Hello,
I am using a planar strip detector, having 256 strips 10cm long.
I defined its geometry with:
number_of_pixels: 256,1
…
pixel_pitch = 400um,100mm
…
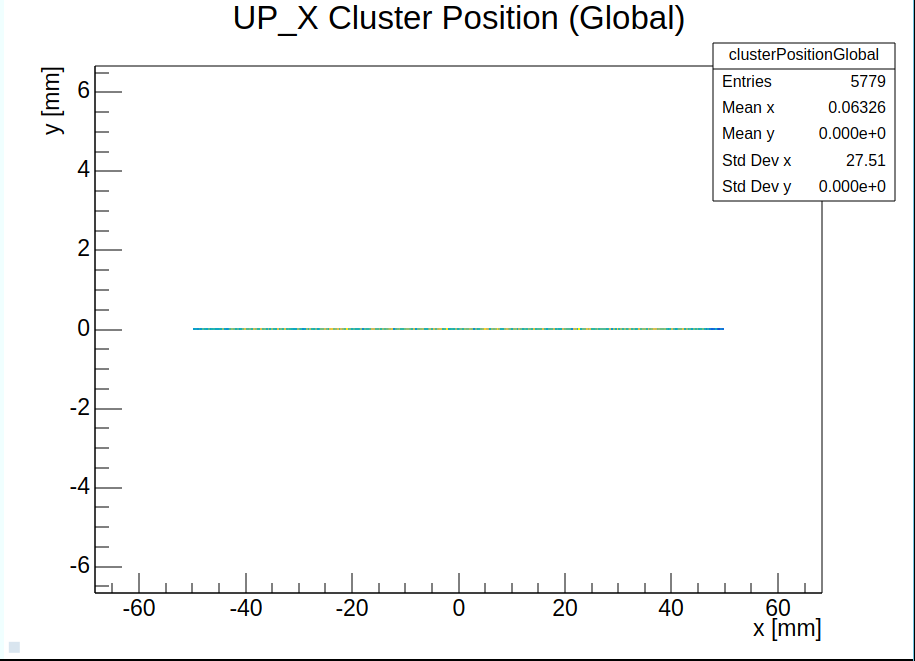
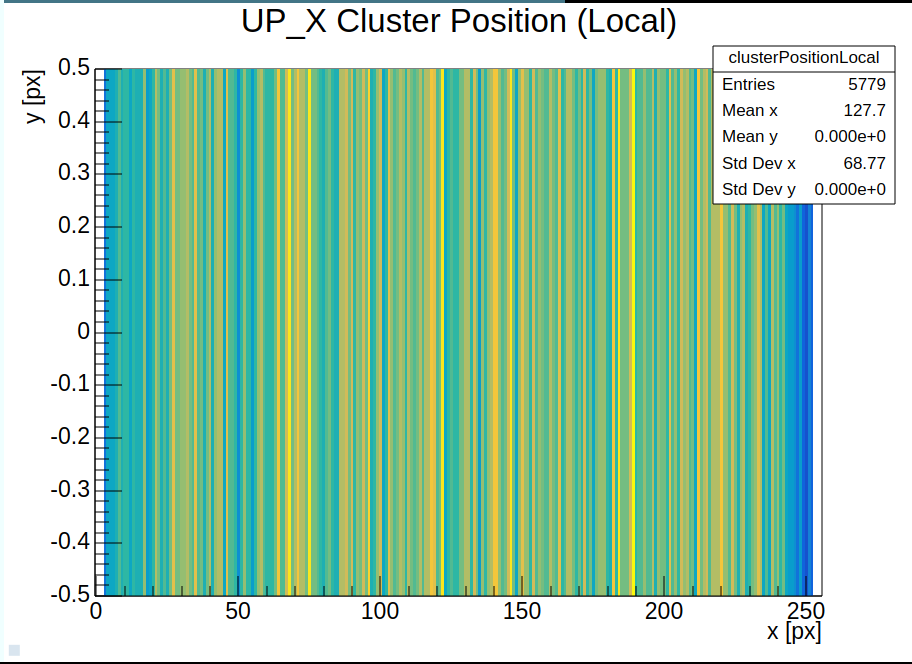
Once I try to run the module “ClusteringSpatial”, I get what I expect from the ClusterPosition(Local) graph, 256x1 px, but not form the ClusterPsition(Global). The latter looks like if if my detector doesn’t have any dimension along y.
To define the size of the detector normally corry does “number_of_pixels*pixel_pitch”, meaning in the ClusterPositionGLobal I should get 10cm along the y-axes.
I get a warning saying: “Pixel pitch unphysical for detector XXX:”
What am I missing?
Thank you!
Hi @esidoret
the warning is in this case a bit misleading, I agree. YOur configuration looks entirely valid to me - and this is also the way, e.g. @naomi uses Corry for her strip sensor.
Would you happen to have an example for the plots that don’t show up as expected?
One thing that you might have to configure is that some modules produce in-channel plots with a granularity on the um level - these would of course be quite huge in your case. These module usually provide a way to reduce the granularity.
Best regards,
Simon
Hello,
here are the plots I was mentioning:
In the local one, I do get one pixel (even if from -0.5 to 0.5 instead of from 0 to 1), in the Global one, the pixel length is 0 instead of 10cm.
Maybe you can spot better what’s going on?
Thank you very much
Elena
Hi @esidoret
the two plots both make sense to me - but I had to stare a bit on them to understand what’s going on… 
So the local coordinates plot is clear - we have one channel in y (the strip) and 256 of them along x, with a pitch of 400um each. Your data does not seem to have entries in the first few and in the last few channels.
Now, for the global coordinates plot I had to remind myself of the title of the histogram: Cluster Position (global) - and then it clicked  Since you only have one measurement along your
 y coordinate, you will always reconstruct the position of the cluster in the center along the length of the strip, no matter whether it hit your sensor at the top or bottom. In this plot, you draw the positions of cluster centers, hence along y they are all fixed to the center of the strip (which is at y = 0 since your detector seems to be centered around (0,0) in global coordinates), and in x either at the strip pitch center or between two strips when you have larger clusters (this I of course can’t see from this data).
If you are looking for more something like a reconstruction of your beam spot, you need to look at the results after tracking with multiple planes of different orientations.
Does it make sense what I deduced?
Best,
Simon
Thank you so much @simonspa !
It makes sense
I’m not sure about what you mean with “tracking with different orientations”. I tried the TrackingMultiplet module and also the other tracking ones, but I get all empty plots. I thought it was because of my y being dimensionless, but I guess not.